The Latest S&P Case-Shiller Report Shows Home Price Growth is Still Strong in Seattle
Following the release of the latest S&P Case Shiller Home Price Index, the Seattle Times once again proclaimed the decline of residential home prices in the Seattle metropolitan area. Contrary to headlines, however, trendlines give way to a more nuanced story. Some are using the Case Shiller Index to reinforce misleading growth reports, so let’s have a look at the data used to calculate the Index and compare it to results gathered from sales data in the Northwest Multiple Listing Service (NWMLS).
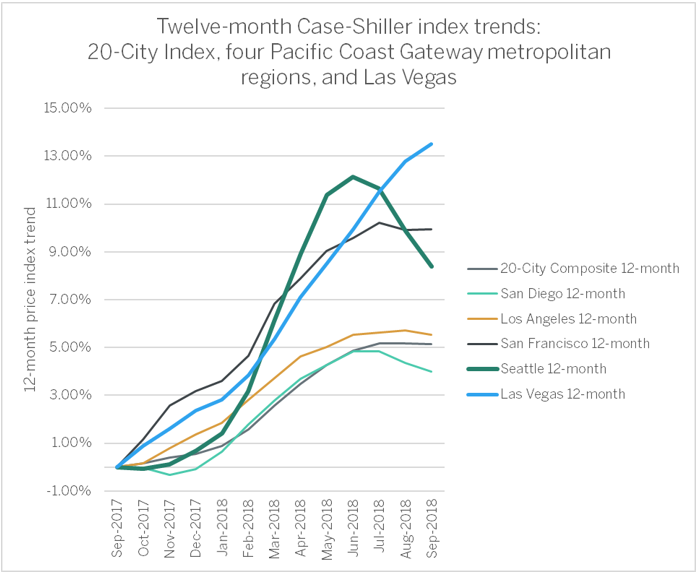
The latest Index looks at data for September 2018 and despite local media suggesting a steep decline for Seattle, the press release discharged in conjunction with Index results still names the Emerald City among the hottest markets in the nation: “Las Vegas, San Francisco and Seattle reported the highest year-over-year gains among the 20 cities. In September, Las Vegas led the way with a 13.5% year-over-year price increase, followed by San Francisco with a 9.9% increase and Seattle with an 8.4% increase.”
Mike Rosenberg of the Times, however, claims that prices are falling faster in Seattle than any other city, adding that “prices haven’t fallen this fast since 2011, when the market was still bottoming out following the recession.”
The Case Shiller report does solidify a 1.34 percent monthly decline in growth for the Seattle market (which comprises King, Snohomish and Pierce counties), the third month in a row in which gains have declined. As Realogics Sotheby’s International Realty (RSIR) noted in a report following the Index results, “these three consecutive months of lower Case Shiller Index results compare with a two-month downturn a year ago (September to October 2017), and a four-month price decline from August through November 2014. The last, deeper slump in the Index—that mentioned in the Times story—began in August 2011 and lasted through February 2012.”
In looking at these declines, a pattern begins to emerge: each Index reversal began late in the summer season. Of course, residential real estate sales do follow seasonal patterns, something that is not accounted for in Case Shiller standard reports (but is noted in Table 3 of their release). This is a key consideration to those using the Case Shiller Index, as Standard & Poor’s, the publishers of the Index, have told readers to heed caution during periods of “market dislocation.” At these points, “S&P urges the use of year-over-year comparisons of the Index or, if month-over-month comparisons are desired,
“I view seasonality, and the recent market pause centered around Amazon’s HQ2, like a speed bump in our trajectory,” said Dean Jones, president and chief executive officer of RSIR. “While the overall trend in 2018 is still increasing over 2017, we climbed the first half of the bump this spring and are coming down the other side more recently. Whether Seattle will post year-over-year declines into 2019 remains to be seen, but I view these adjustments as healthy and balancing.”
Below, RSIR has compiled residential sales data from the NWMLS for areas coveted by the Index. While these data are not equivalent to those surveyed by Case Shiller, they accurately represent the prices that buyers and sellers of single-family homes have encountered in the market. Data shows that rather than a decline in sales prices, median selling prices are on the rise, just at a slower pace than previously reported in the region.
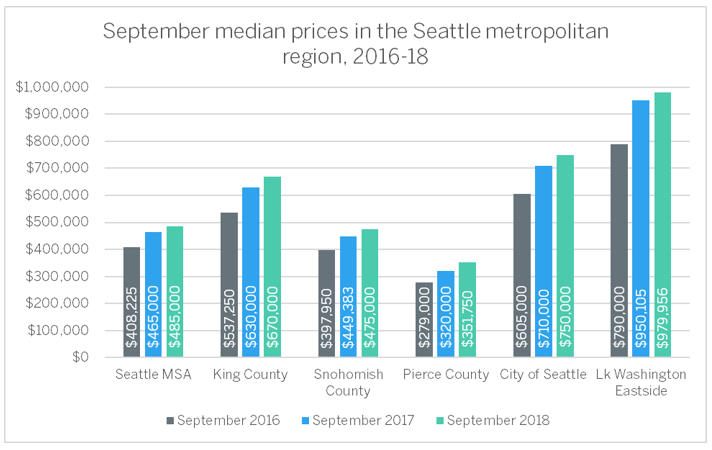
(Note: selling data for “Lake Washington Eastside” comprise transactions in the following communities: Beaux Arts, Bellevue, Clyde Hill, Hunts Point, Issaquah, Kirkland, Medina, Mercer Island, Newcastle, Redmond, Sammamish, Woodinville, and Yarrow Point.)
Turning to the seasonally-adjusted Index results recommended by S&P on a monthly basis, Seattle home prices were down -1.0 percent in August and -0.3 percent in September.
For Seattle’s comparative performance on the Case-Shiller Index, see our chart of the Index trends below; and for more details, download the S&P Dow Jones Case-Shiller summary report.